See how your choices
could shape your income.
Explore income, investment risk and savings—or start with our dedicated federal retirement tools. No signup required. The amounts entered here are calculated in your browser and are not submitted to us.
Explore more tools and guides
Risk & Diversification
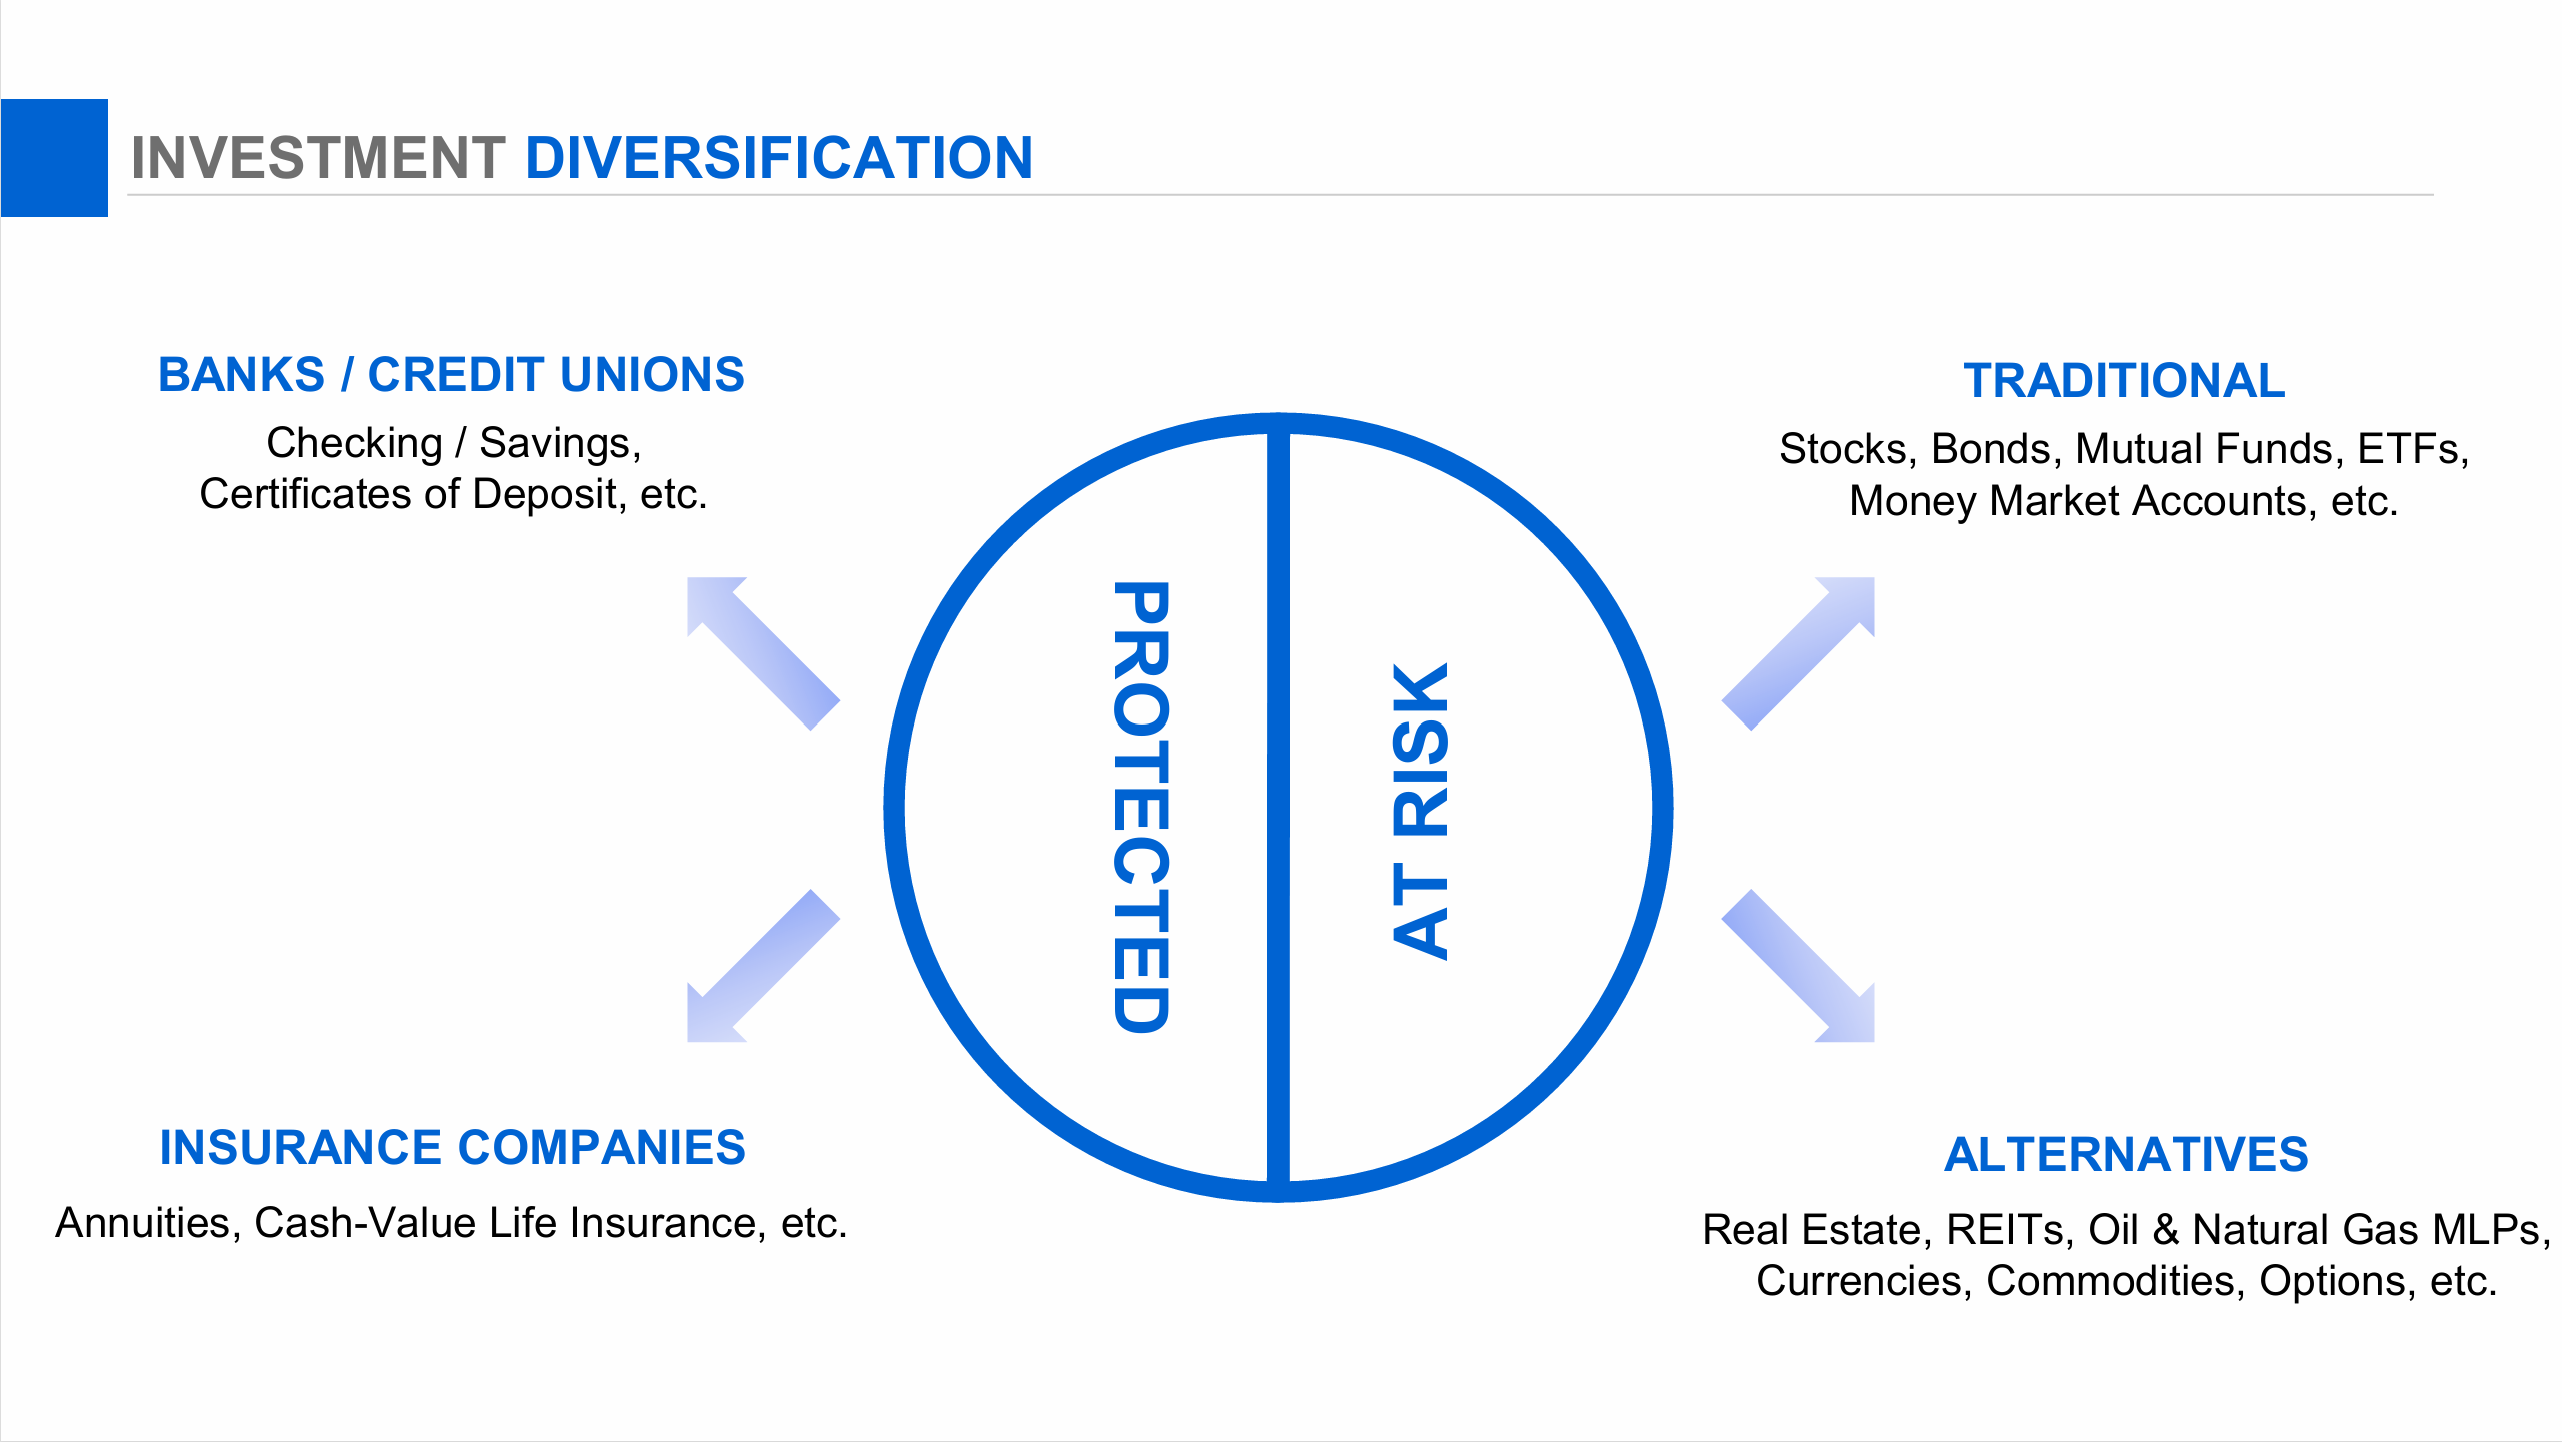
Select the image to view it at full size. Protections and risks vary by product and account.
Retirement income gap
Use monthly amounts in today’s dollars, after taxes. Include all spending you expect in retirement.
A gap is the amount you would need from savings or other sources. A surplus does not establish that your retirement plan is sufficient. This snapshot does not project future changes in income, expenses, or taxes.
Request a free retirement income review
Discuss your income needs and any annuity you already own. We will contact you to arrange a time with a consultant.
TSP & market-decline simulator
Explore a TSP or other investment account with the same hypothetical decline early or later in a 25-year retirement. This does not model individual TSP funds or their actual returns.
Stress-test the next downturn
Try a hypothetical decline in the exposed portion of your account. These are planning scenarios, not predictions.
For TSP participants: these are stock-market scenarios, not actual TSP fund returns. Your account's response depends on the investments you hold and the share exposed to the modeled loss. The simulator applies the decline only to the percentage you enter as exposed; it does not automatically apply it to your entire TSP balance.
Includes 22 U.S. bear markets (1929–2022) and four notable corrections. Peak-to-trough S&P price-index losses exclude dividends; early history predates the modern S&P 500. Source: Yardeni Research, January 2024, pages 4–6. This is not a live market feed.
Selecting history applies only its loss percentage in one simulation year. It does not replay the event’s duration or recovery, or represent your actual holdings.
Understand the loss. Plan for the recovery.
A 50% loss needs a 100% gain to break even. Continuing withdrawals can make recovery harder.
These percentages use your selected decline and exposure. They show an immediate shock to the starting balance, before withdrawals—not a prediction or a measure of your actual risk. With a total loss, recovery requires new money.
View annual account balances
| Year | No decline | Decline in year 1 | Decline in year 10 |
|---|---|---|---|
| 0 | $500,000 | $500,000 | $500,000 |
| 1 | $496,000 | $386,000 | $496,000 |
| 2 | $491,360 | $376,960 | $491,360 |
| 3 | $486,045 | $367,069 | $486,045 |
| 4 | $480,018 | $356,283 | $480,018 |
| 5 | $473,240 | $344,555 | $473,240 |
| 6 | $465,672 | $331,840 | $465,672 |
| 7 | $457,271 | $318,085 | $457,271 |
| 8 | $447,993 | $303,240 | $447,993 |
| 9 | $437,793 | $287,250 | $437,793 |
| 10 | $426,622 | $270,058 | $330,308 |
| 11 | $414,431 | $251,604 | $314,264 |
| 12 | $401,168 | $231,828 | $296,994 |
| 13 | $386,777 | $210,663 | $278,436 |
| 14 | $371,201 | $188,043 | $258,527 |
| 15 | $354,382 | $163,897 | $237,200 |
| 16 | $336,256 | $138,152 | $214,388 |
| 17 | $316,759 | $110,731 | $190,016 |
| 18 | $295,824 | $81,555 | $164,011 |
| 19 | $273,379 | $50,539 | $136,294 |
| 20 | $249,351 | $17,597 | $106,782 |
| 21 | $223,662 | $0 | $75,390 |
| 22 | $196,232 | $0 | $42,030 |
| 23 | $166,978 | $0 | $6,608 |
| 24 | $135,812 | $0 | $0 |
| 25 | $102,642 | $0 | $0 |
Illustration only, not a forecast or an account analysis. The decline applies only to the selected share; the rest is unchanged during that year. The decline replaces the normal annual return that year. In other years, the selected return applies to the entire account. Returns occur before year-end withdrawals; withdrawals increase annually at the selected rate. No contributions, fees, taxes, rebalancing, or product guarantees are modeled. Balances cannot fall below zero; unfunded withdrawals are shown separately. Dollar results are not adjusted for inflation. Real returns vary and losses can recur.
These are hypothetical investment-account scenarios, not annuity illustrations. Annuity income and guarantees require an actual contract review.
Could you cover expenses without selling investments during a downturn?
Start with the gap between your spending and available income. Then use the bucket worksheet to organize reserves and plan where withdrawals could come from.
Calculate my retirement income gap →
Download the fillable bucket worksheet (PDF) · Explore the bucket strategy →
Compound-interest calculator
Explore how a starting balance and regular monthly contributions could grow over time.
View annual growth breakdown
| Year | Contributions | Growth | Balance |
|---|---|---|---|
| 0 | $10,000 | $0 | $10,000 |
| 1 | $13,000 | $581 | $13,581 |
| 2 | $16,000 | $1,346 | $17,346 |
| 3 | $19,000 | $2,303 | $21,303 |
| 4 | $22,000 | $3,463 | $25,463 |
| 5 | $25,000 | $4,835 | $29,835 |
| 6 | $28,000 | $6,431 | $34,431 |
| 7 | $31,000 | $8,263 | $39,263 |
| 8 | $34,000 | $10,341 | $44,341 |
| 9 | $37,000 | $12,679 | $49,679 |
| 10 | $40,000 | $15,291 | $55,291 |
| 11 | $43,000 | $18,189 | $61,189 |
| 12 | $46,000 | $21,389 | $67,389 |
| 13 | $49,000 | $24,907 | $73,907 |
| 14 | $52,000 | $28,758 | $80,758 |
| 15 | $55,000 | $32,959 | $87,959 |
| 16 | $58,000 | $37,529 | $95,529 |
| 17 | $61,000 | $42,486 | $103,486 |
| 18 | $64,000 | $47,851 | $111,851 |
| 19 | $67,000 | $53,643 | $120,643 |
| 20 | $70,000 | $59,885 | $129,885 |
Illustration only, not a forecast or product quote. Assumes a constant nominal annual rate divided by 12, compounded monthly, with contributions at the end of each month. Contributions include the starting balance. Excludes fees, taxes, inflation, withdrawals, and market losses. The assumed rate is not an APY, guaranteed return, or annuity crediting rate; actual investment returns vary.
CD comparison calculator
Compare three fixed-rate certificates of deposit using the same deposit. Enter quoted APYs and terms. These examples are illustrative, not current bank offers.
Different terms have different maturity dates. More interest over a longer term does not necessarily mean a better annual yield. No renewal or future reinvestment rate is assumed.
How this estimate works
Maturity value = deposit × (1 + APY / 100) raised to (months / 12). APY already includes compounding; do not enter the nominal interest rate. Assumes a fixed APY, interest retained, and holding to maturity. Actual day counts and bank terms can change results. Excludes taxes, fees, early-withdrawal penalties, callable CDs, and market-linked CDs. Confirm withdrawal rules and deposit insurance with the institution. Learn about CDs at Investor.gov.
Put the numbers in context.
Discuss your income needs, current accounts, trusts, life insurance, annuity options, or real estate goals in a complimentary consultation.
Request a free consultation →